Generation of Indoor Map Data
The availability of accessible indoor maps requires a broad data base, which provides basic information about the structure of the floors and their connection as well as further information of the accessibility of various objects in a building. An initial analysis showed that there is no sufficient amount of indoor map data in commercial or freely accessible map services. It is therefore necessary to generate appropriate data and to make it available in an accessible manner.
Open Source Indoor Map Data as Basis for the Development of Indoor Maps
Considering that there is no possibility to generalize the output formats of maps for the specific requirements of the users, an extensive application landscape is required for the output of indoor maps. This leads to the conclusion that such diversity, which involve small and large groups of users, requires freely accessible indoor map data. Therefore, it was decided within the project to use Simple Indoor Tagging as the target format and to make the recorded data freely accessible in OpenStreetMap.
The Influence of different Scenarios on the Mapping Process
Basically, there are two different starting situations with influence the data collection. On the one hand, map data can already be available in a different digital format, which allows to transform them into the desired format. On the other hand, there is the possibility that no digital map data are available or that they are not freely accessible. In this case the data has to be collected manually. Therefore, analogue maps, such as escape plans, can support the recording process. Both options are addressed within the AccessibleMaps project. Moreover, one project goal is to develop prototypical solutions to solve the given challenges.
Tool to Transform Existing Indoor Maps in other Formats
If indoor map data already exist in a different format, then it should be possible to convert it into a target format. For example, if architectural data are available, wall thicknesses and unnecessary elements can be removed which reduces the amount of data and adapts the data for later visualization. (See Figure: Screenshot of the User Interface of an Application to Convert Indoor Map Formats)

Long description
The picture shows a window application for the detection of rooms and other objects from escape plans, which is divided into three areas from left to right. The left area gives the possibility to load an image file and offers the possibility to select different working steps up to the room detection individually. In the middle area, the detected rooms are visualized by colored rectangles. The right area contains the view of the loaded escape plan.
Tool to Generate Indoor Maps from Escape Plans
In case of manual collection of indoor map data, an application was developed which analyses images of escape plans and automatically recognizes rooms, stairs, elevators and doors. This information is used to generate a first data set for the corresponding building part, which then has to be manually corrected and merged with other parts of the building. (See Figure: Screenshot of the User Interface of the Escape Plan Transformation Tool)
In this demo video the functionality of MapScape is explained using the example of the Andreas-Pfitzmann-Building of the TU Dresden:

Long description
The picture shows a window application for the detection of rooms and other objects from escape plans, which is divided into three areas from left to right. The left area gives the possibility to load an image file and offers the possibility to select different working steps up to the room detection individually. In the middle area, the detected rooms are visualized by colored rectangles. The right area contains the view of the loaded escape plan.
Enrichment of Indoor Map Data with Accessibility Information
In addition to the collection of basic indoor map data, the collection and validation of accessibility information of buildings and contained objects are requirements too. In order to achieve this, various approaches will be developed within the project which are intended to support the mappers.
Tool to Verify the Correctness and Richness of Accessibility Information
As a part of the research project, a prototype will be developed, which is named SIT-MapChecker. This application analyses the current status of building and visualises them for users. Different requirements for indoor map data are divided into achievements, which facilitate the collection process and make it possible to enter further data in a simplified way. (See Figure: Screenshot of the SIT-MapChecker User Interface)
In this demo video the functionality of the SIT-MapChecker is explained using the example of the Andreas-Pfitzmann-Building of the TU Dresden:

Long description
The image shows a window application for analyzing indoor map data, which is divided into three areas from left to right. The left area contains a search field and the visualization of the currently selected floor of the building. The center area displays Achievements already achieved as well as general building information. In the right area, the still open achievements are displayed textually as well as a filter function regarding them.
Tool to Enrich Accessibility Features using Computer Vision
As a part of the research project, a computer vision-based prototype will be developed. This application uses visual data collected by cameras as input, reconstructs an indoor environment, and obtains dense semantic information of the indoor space. Recognition of both static- and moving objects based on Artificial Intelligence will facilitate enrichment of important accessibility features onto indoor maps (see Figure).
The functionality of the developed prototype is explained in this demo video in more detail:
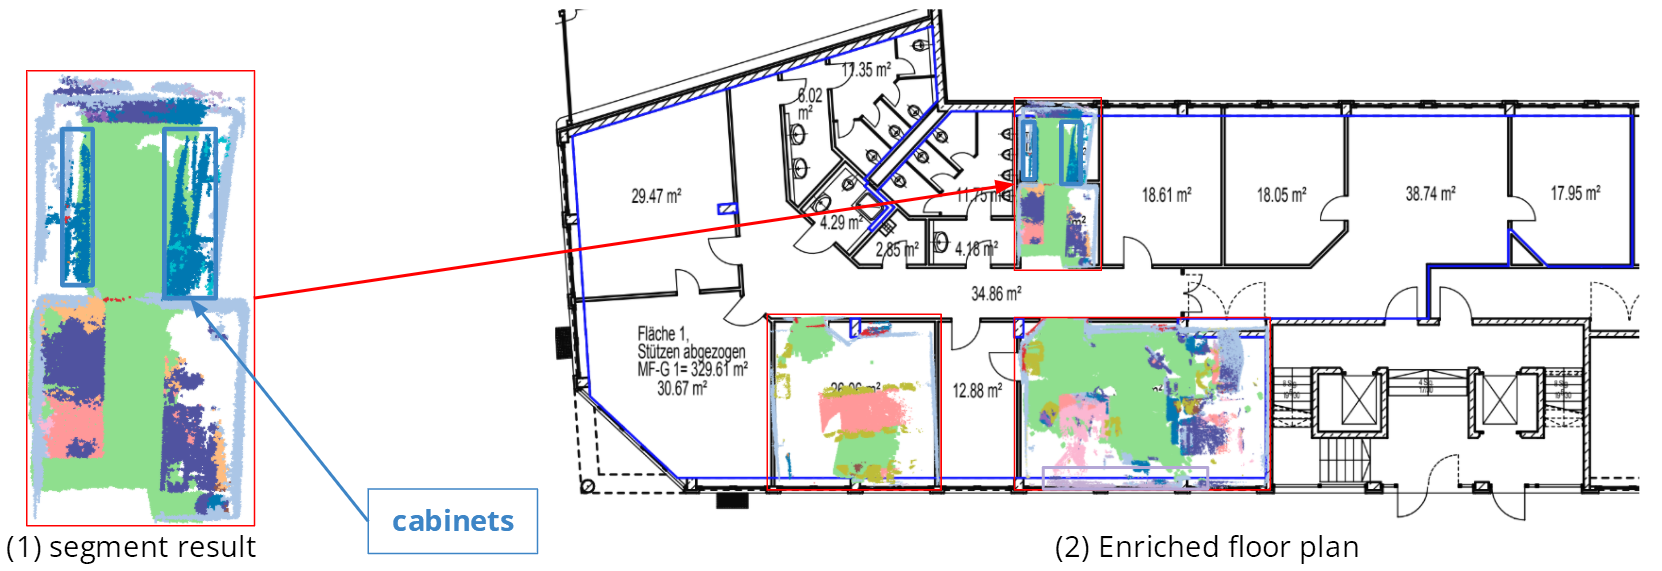
Long description
Floor plan of a building enriched with additional information. On the left, a room is shown enlarged. A red arrow points from the section on the left to the place where the room is located in the floor plan. The computer vision component provides additional information about the room, e.g. which area is floor, where tables, chairs or cabinets are located. This information is coded by coloring the floor where the objects are located with a different color.